|
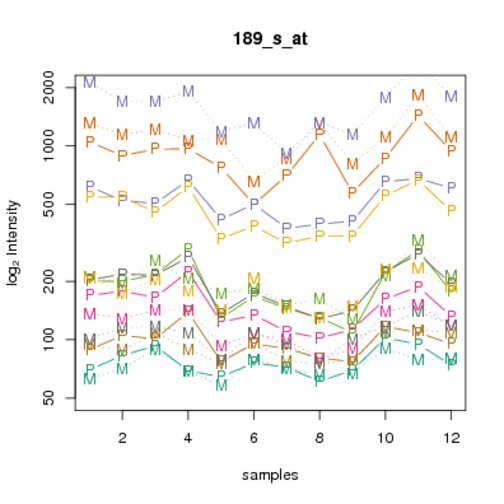
| Figure 3.12: Intensities of eight PM probes and their associated MM probes from the probe set 189 _s _at, which targets the PLAUR gene. Shown are the data for the first 12 samples of the CLLB dataset. Note how the profiles of most (but not all) of the probes are correlated across samples, but have very different baselines (this is the so-called probe effect ). Also, in some cases the MM values are larger than the PM values. |