Hypergeometric Tests for Gene Lists
The Category and GOstats BioC Packages
| Authors: | Seth Falcon and Robert Gentleman |
|---|---|
| Date: | 2007-01-06 |
In Brief
- Obtain data (microarray)
- Select interesting genes
- Choose a category database (GO)
- Test whether any category terms are over represented, giving functional insight into a subset of the gene list.
And a bit less brief
- Obtain data (microarray)
- Process data into an ExpressionSet
- Perform non-specific filtering
- Define the gene universe
- Select interesting genes
- Use the method of your choice. Our example will use a simple t-test for differential expression between two groups
And a bit less brief
- Choose a category database (GO)
- Besides GO, we support KEGG and PFAM.
- Hope to have support for chromosome location soon.
- Test whether any category terms are over
represented, giving functional insight into a
subset of the gene list.
- Can also test for under representation, although this is not often done.
- Interpreting the test can be difficult because of multiple testing.
- For GO, there are modified testing algorithms that take the relationships among the GO terms into account.
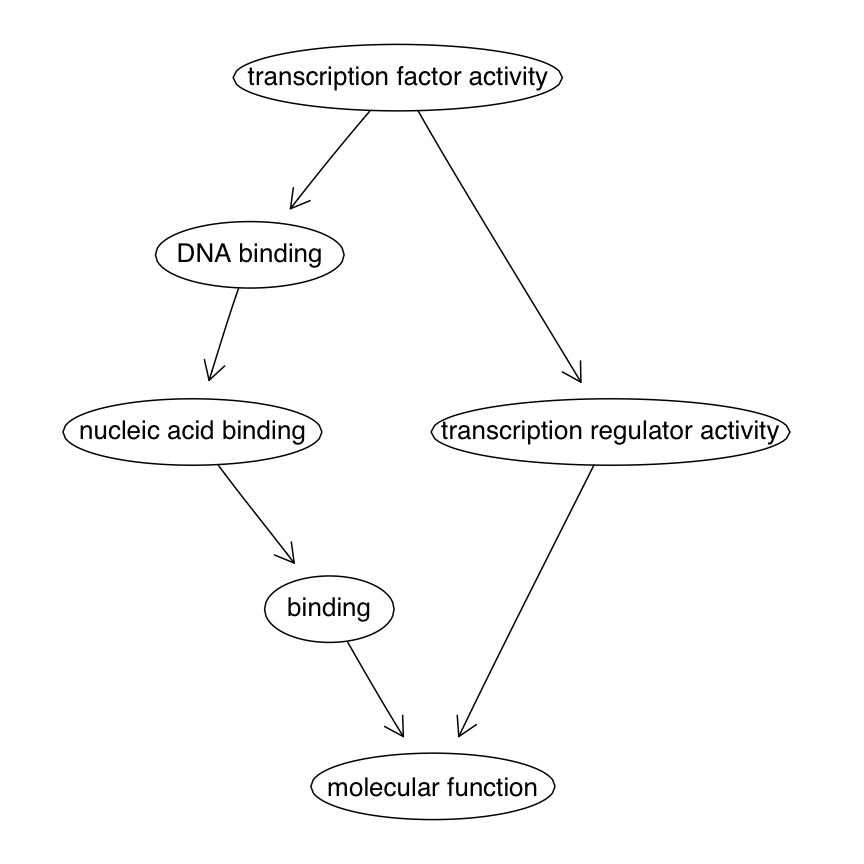
Reviewing GO
- Three ontologies, each is a DAG:
- BP Biological Process
- CC Celullar Component
- MF Molecular Function
- Each GO Term has zero or more Entrez Gene IDs annotated at it.
- Parent terms inherit annotations from child terms.
MF subgraph
GO Evidence Codes
| IMP: | inferred from mutant phenotype |
|---|---|
| IGI: | inferred from genetic interaction |
| IPI: | inferred from physical interaction |
| ISS: | inferred from sequence similarity |
| IDA: | inferred from direct assay |
| IEP: | inferred from expression pattern |
| IEA: | inferred from electronic annotation |
| TAS: | traceable author statement |
| NAS: | non-traceable author statement |
| ND: | no biological data available |
| IC: | inferred by curator |
Back to the question
Are there any GO terms that have a larger than expected subset of our selected genes in their annotation list?
If so, these GO terms will give us insight into the functional characterisitcs of the respective subset of the gene list.
But what does larger than expected mean?
Classical probability
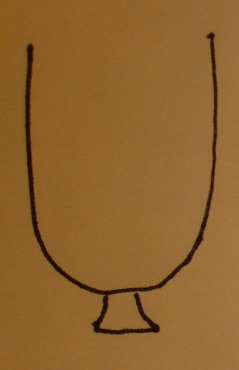
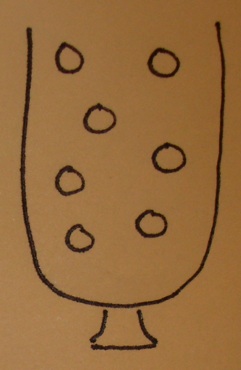
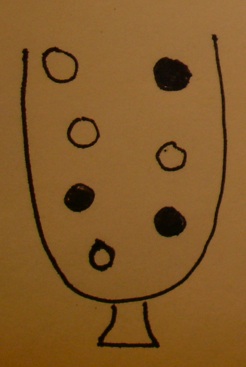
An urn model
- The urn contains a ball for each gene in the gene universe.
- Paint the balls representing genes in our selected list white and paint the rest black.
- Don't forget to label the balls so that you know which gene is which!
The Hypergeometric Distribution
From Wikipedia, the free encyclopedia:
... the hypergeometric distribution is a discrete probability distribution that describes the number of successes in a sequence of n draws from a finite population without replacement.
TODO: insert detailed proof that a hypergeometric test is equivalent to a one-tailed Fisher's Exact test.
Testing a term (1)
Testing a GO term amounts to drawing the genes annotated at it from the urn and tallying white and black.
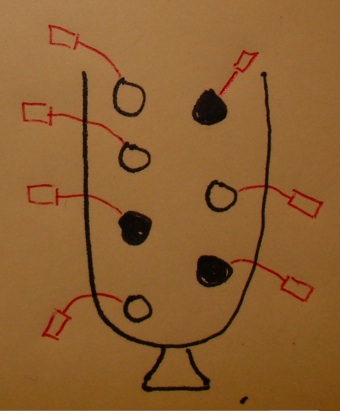
Testing a term (2)
| . | Selected (white) | Not (black) |
|---|---|---|
| in GO term | n11 | n12 |
| not in GO term | n21 | n22 |
Testing a GO term amounts to drawing the genes annotated at it from the urn and filling out the table.
NB: You can apply other two-way table tests besides Fisher's Exact test. For large categories, that may make sense.
What's in the universe?
What genes were candidates for selection?
The choice makes a big impact on Hypergeometric test results.
Possibilities:
- All genes that have a GO annotation
- All genes on the chip
- All genes from the chip that pass a non-specific filter
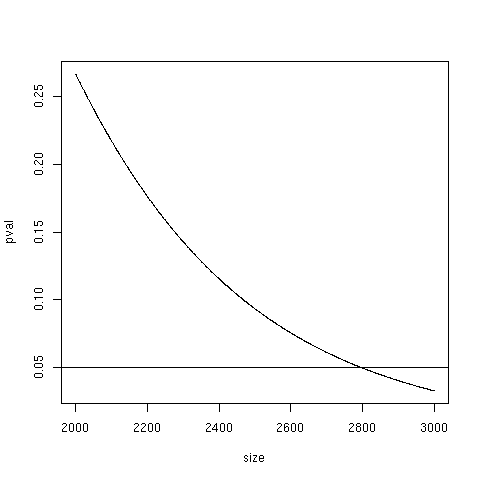
The universe matters
P <- function(size) {
    nFound <- 10
    nDrawn <- 400
    nAtCat <- 40
    nNotAtCat <- size - nAtCat
    phyper(nFound-1, nAtCat, nNotAtCat,
           nDrawn, lower.tail=FALSE)
}

                   P(1000) ---> 0.986
                   P(5000) ---> 0.000914
Non-specific filtering
- Remove probe sets with no Entrez Gene ID or no GO annotation.
- Compute IQR, and filter out probe sets with little variance across samples.
- If two or more probe sets map to the same Entrez Gene ID, keep only one (the one with largest IQR). This is important to avoid double counting.
Review
- Obtain data
- Perform non-specific filtering, decide on a gene universe.
- Select interesting genes.
- Use GOstats to compute over representation of GO terms.
Using the Category and GOstats Packages
First, a short diversion:
Object Oriented Programming in R: the S4 Object System.
- Classes structure data and encapsulate noun concepts
- Methods (functions) operate on objects (instances of classes). They do the right thing based on the object's class. They encapsulate verb concepts.
Key classes in Category & GOstats
Inputs:
HyperGParams

  GOHyperGParams
  KEGGHyperGParams
  PFAMHyperGParams
Outputs:
HyperGResult GOHyperGResult
Input: GOHyperGParams accessors
If p is a GOHyperGParams instance:
geneIds(p)              testDirection(p)
universeGeneIds(p)      conditional(p)
annotation(p)           pvalueCutoff(p)
ontology(p)
There are also replacement forms for setting:
conditional(p) <- TRUE
pvalueCutoff(p) <- 0.0000001
Output: GOHyperGResult accessors
If r is a GOHyperGResult instances:
pvalues           universeCounts    summary
oddsRatios        geneCounts        htmlReport
expectedCounts    goDag
                  geneIdUniverse
                  selectedGenes
Most of the accessors for HyperGParams work here too, so you can answer: Was it conditionl? Over or under representation? Etc.
hyperGTest
hyperGTest(p)
p can be a:
- GOHyperGParams
- KEGGHyperGParams
- PFAMHyperGParams
Parameter class design makes it easier to run many tests and allows using a single instance as a template for tweaking.
GO and Hypergeometric Dangers
The Hypergeometric test assumes independence of categories.
GO terms are not independent of each other.
Test results often include directly related terms with significant gene overlap.
Is there really evidence for both terms?
GO Testing Philosophy
More general statements require evidence beyond that which is required to prove more specific statements.
This is an essential component of the scientific method.
We only want to call a GO term significant if there is evidence beyond that provided by its significant children.
A Conditional Algorithm
Condition out child terms that have tested as significant when testing a given term.
Assess whether there is additional evidence for the parent term.
How:
- Walk leaves of the GO DAG, compute Hypergeometric as usual.
- When computing the next level, remove genes from significant children.
Lab Time
- ALL dataset (ALL1/AF4 vs NEG)
- Work through details of non-specific filtering
- Play with hyperGTest
- Try out KEGG and PFAM based tests